
CRU Predicts 8.8 Billion Fiber-km Demand by 2027: Why the Global Fiber Market Is Entering a Super Cycle
Published:Executive Summary: The global fiber optic cable market is experiencing a structural shift unlike anything seen since the "Broadband China" era of 2015–2018. According to CRU Group, global fiber demand is on track to surpass 8.8 billion fiber-km by 2027. Unlike the previous cycle driven by a single force, this one has three simultaneous demand shocks firing at once: AI data centers, fiber-guided military drones, and global telecom FTTx/5G expansion. Meanwhile, global supply capacity remains structurally locked — preform capacity expansion takes 18 to 24 months, and ~90% of tier-1 production lines are already committed to long-term agreements. The result: prices up 10× for specialty fibers, standard lead times extending to 52 weeks, and a supply-demand gap that multiple institutions project will persist through 2027–2028.
Quick Navigation
- 1 The Scissors Gap: Why Demand Is Outpacing Supply at Historic Rates
- 2 Three Engines Driving Demand — AI, Defense, and Telecom
- 3 Why Can't Supply Keep Up? The Preform Bottleneck
- 4 Price Super Cycle: From ¥35 to ¥94.2 in Three Months
- 5 The AI Data Center Factor: Why One AI Cluster = 5–10 Traditional Data Centers
- 6 Global Market Landscape: China's Four Giants Control Half the World
- 7 Hollow-Core Fiber: The Next Disruptor Entering Commercial Deployment
- 8 Procurement Action Items: What Infrastructure Buyers Must Do Now
- 9 Key Takeaways & Conclusion

AI infrastructure buildout is driving unprecedented demand for high-density fiber optic cabling — the backbone of next-generation compute clusters
Chapter 1: The Scissors Gap — Why Demand Is Outpacing Supply at Historic Rates
The 2027 CRU forecast of 8.8 billion fiber-km demand is not an outlier — it represents the convergence of three simultaneous demand shocks that the market has never experienced in the same cycle before. Unlike the 2015–2018 cycle, which was driven by a single force (Chinese FTTH rollout concentrated in one market), this cycle has three demand engines firing simultaneously — and they are all drawing from the same global fiber production base.

High-density fiber patching in a modern AI-ready data center — port counts and fiber counts grow exponentially with AI workloads
Chapter 2: Three Engines Driving Demand — AI, Defense, and Telecom
Engine 1: AI Data Centers — From 69.6M to 244M Fiber-km
AI data center fiber demand surged +75.9% year-over-year in 2025, reaching 69.6 million fiber-km. By 2027, that number is projected to exceed 244 million fiber-km — a 3.5× increase in just two years. The core driver: AI network architectures demand full-mesh leaf-spine connectivity, consuming 5–10× more fiber per rack than traditional cloud workloads. A single 10,000-GPU cluster can require 100,000–500,000 fiber-km of internal connectivity alone.
Engine 2: Fiber-Guided Drones — The Unexpected Demand Surge
FPV (fiber optic guidance) drones use ultra-thin fiber physically connected between the drone and its controller, delivering <1ms latency and complete immunity to electronic warfare jamming. Fiber-guided drones have a failure rate of less than 10% in contested environments, compared to 75–90% for traditional wireless drones. The fiber in these systems is a one-time consumable — every mission consumes fiber permanently. Global military fiber demand is projected at approximately 146 million fiber-km in 2026, growing to 152 million in 2027.
Engine 3: Global Telecom FTTx and 5G — The Structural Floor
Even as AI and defense absorb an increasing share of fiber production, global telecom operators continue to represent the demand base of the market. The US BEAD program, EU FTTP rollout, India BharatNet initiative, and ongoing 5G-A deployment in China provide a structural floor of ~444–455 million fiber-km per year. Global FTTH penetration is projected to grow from 30.4% (2025) to 41.1% (2027).
| Demand Engine | 2025 Usage | 2027E Demand | Growth | Key Driver |
|---|---|---|---|---|
| AI Data Centers | 69.6M fiber-km | 244M fiber-km | +150% in 2026 | GPU clusters, leaf-spine full-mesh, DCI expansion |
| Fiber-Guided Drones (Defense) | ~57M fiber-km | 152M fiber-km | +155% (2025) | FPV drone deployment, strategic reserves (non-recoverable) |
| Telecom Operators (FTTx/5G) | ~420M fiber-km | 455M fiber-km | +4.6% YoY | US BEAD, EU FTTP, India BharatNet, 5G-A rollout |
| Total Global Demand | ~662M fiber-km | ~889M fiber-km | +17% CAGR | Multi-sector convergence |
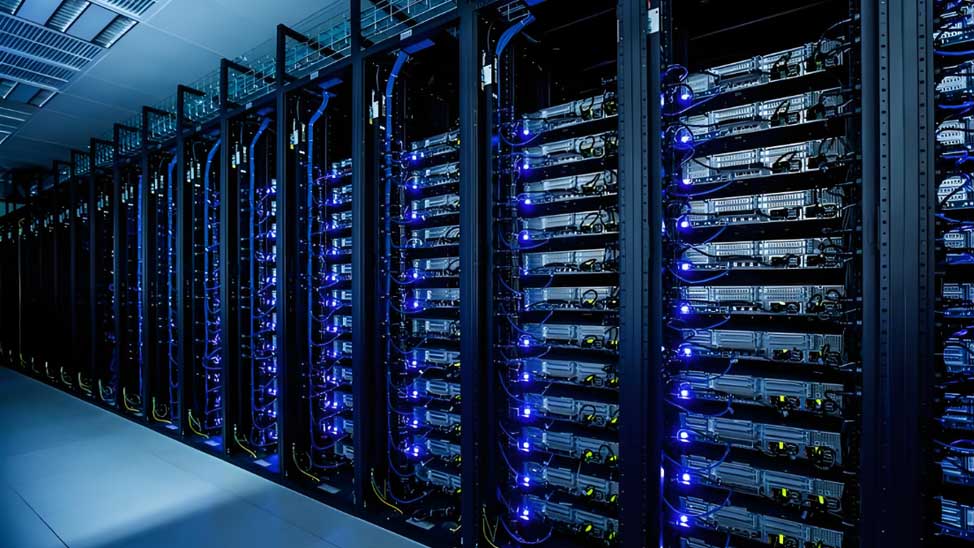
Every transition point in the AI data center network — from GPU to switch to fiber trunk — multiplies fiber consumption compared to traditional architectures
Chapter 3: Why Can't Supply Keep Up? The Preform Bottleneck
The Real Bottleneck: Optical Fiber Preform, Not Fiber Drawing
The bottleneck is not at the fiber-drawing stage — it's at the optical fiber preform. Preform is the glass rod from which fiber is drawn, and building a new preform production line takes 18 to 24 months, plus additional time for yield ramp-up and customer qualification. Globally, only about 20 companies can produce preform at scale. The top five control roughly 60% of global capacity, and every one of them is running at or near full utilization.
📋 Case: Long-Term Supply Agreements (LTAs) Reshaping the Market
- Corning + Meta: $6 billion, multi-year supply agreement through 2030
- NVIDIA + Fiber Suppliers: Warrants worth up to $2.7 billion to lock production capacity
- Amazon: Multi-billion dollar long-term commitment with undisclosed fiber manufacturers
- ZTT (中天科技): Overseas orders booked through 2027; customers must pay deposits to lock factory capacity
- YOFC (长飞光纤): Order backlog exceeds RMB 12 billion
Approximately 90% of tier-1 production lines are now locked by long-term agreements, leaving only a sliver of现货 (spot market) supply — which is why prices have exploded across every market simultaneously.
Geographic Concentration of Supply
Asia-Pacific and North America dominate global output. Chinese manufacturers account for approximately 60% of global production, with the remaining capacity shared among Corning (USA), Fujikura (Japan), Sumitomo (Japan), and Prysmian (Europe). When Chinese factories are running at full capacity serving domestic AI data center demand, international spot supply shrinks for everyone — driving prices up in the US, Europe, India, and Southeast Asia simultaneously.
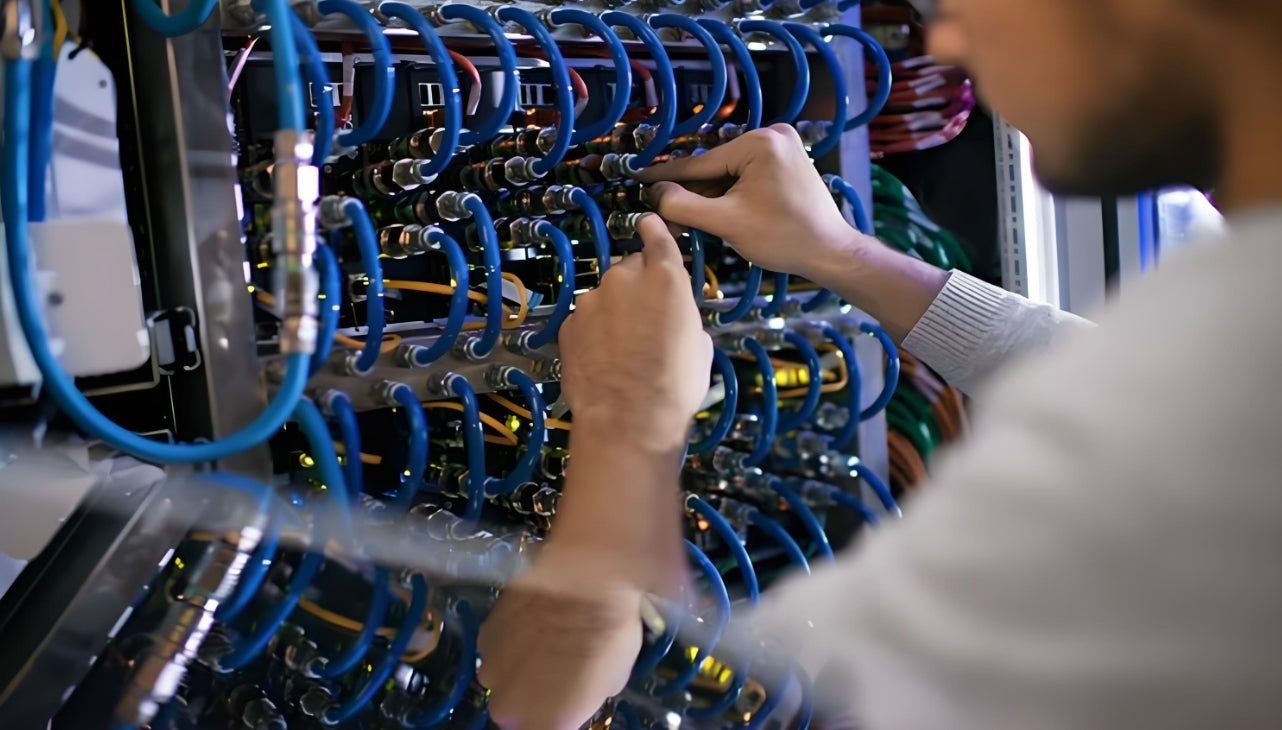
Fiber optic quality testing and certification — as global supply tightens, verifying performance specifications becomes critical for procurement teams
Chapter 4: Price Super Cycle — From ¥35 to ¥94.2 in Three Months
China G.652.D Fiber: 165% in 90 Days
China's G.652.D fiber spot price is the most visible barometer of the global squeeze. According to CRU, the domestic market price surged from approximately ¥35.5/fiber-km in January 2026 to ¥94.2/fiber-km by March 2026 — a staggering 165% increase in just three months, surpassing the previous cycle peak. But the real story is in specialty fibers.
G.657.A2: 10× Price Increase in 12 Months
G.657.A2 fiber — the bend-insensitive type preferred by high-density data center deployments and increasingly by the defense sector — has seen prices increase 10× within a single year, from $3–4/fiber-km to over $30/fiber-km. Even at that price, lead times stretch to nearly a year for custom orders. Industry standard delivery cycles have extended to 20+ weeks;中小客户 custom products face nearly one-year lead times.
Global fiber industry profits tell the story clearly: in the first half of 2026, China's fiber manufacturing sector reported year-over-year profit growth of 410.4% — a number that underscores the magnitude of this pricing super cycle.
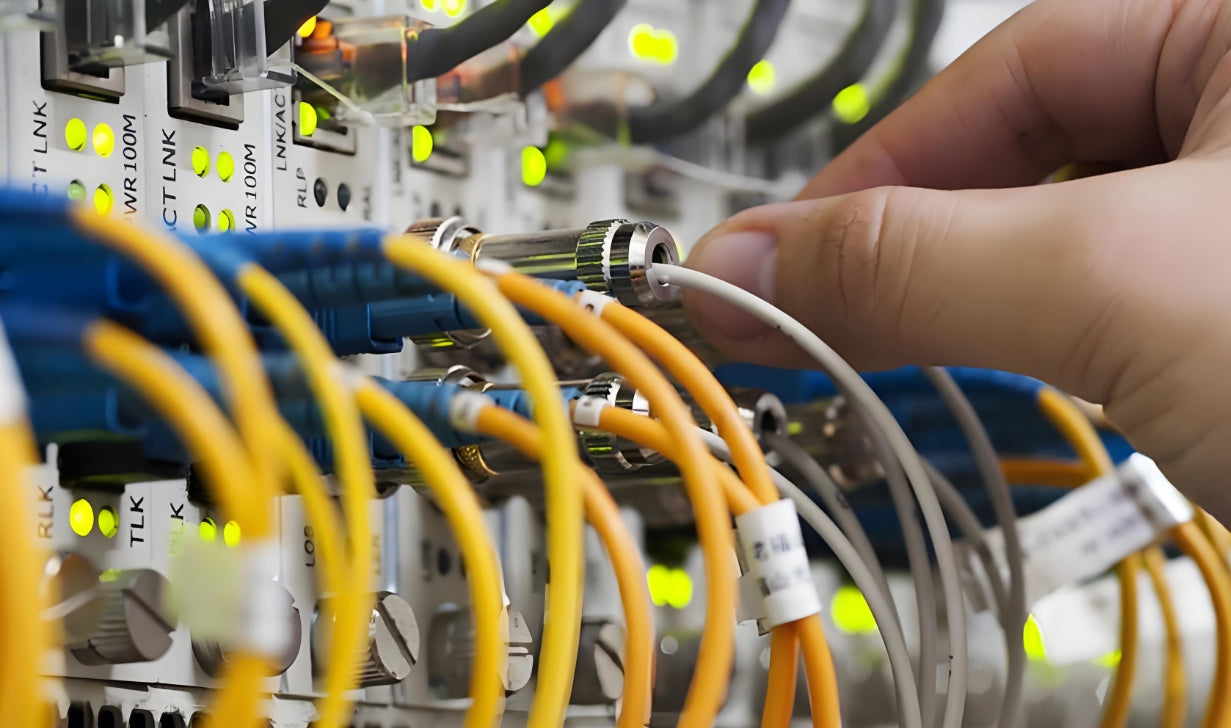
As fiber prices surge globally, quality verification and testing become essential — verifying specifications against purchase orders prevents costly field failures
Chapter 5: The AI Data Center Factor — Why One AI Cluster = 5–10 Traditional Data Centers
Architectural Shift: From Three-Tier to Full-Mesh
AI data centers are not just bigger — they are architecturally different. Traditional cloud data centers use a three-tier aggregation model. AI clusters require a full-mesh leaf-spine architecture where every GPU server needs high-bandwidth connectivity to every other server in the cluster, at latencies measured in nanoseconds. This architectural shift has a compounding effect on fiber consumption:
- Port density explosion: 800G and 1.6T switches require 12–16 fiber pairs per port (vs. 2 pairs for 400G)
- Cluster scale: A 10,000-GPU cluster alone requires 100,000–500,000 fiber-km for internal connectivity
- Continuous expansion: Unlike traditional build-once projects, AI clusters are continuously expanded, creating recurring fiber demand
- Meta Louisiana campus: A single hyperscale AI facility requires 8 million miles of fiber — equivalent to 8× a typical year's US FTTH deployment
The Scale-Out vs. Scale-Up Topology Shift
Per CITIC Securities research, Scale-Out (data center internal connectivity) and Scale-Across (DCI — data center interconnect) are the primary near-term demand drivers. Scale-Up (server internal connectivity) — driven by CPO (Co-Packaged Optics) and OIO (Optical I/O) — will begin contributing incremental demand from 2027 onward as these technologies reach commercial scale. Corning projects the Scale-Across market alone will reach $1 billion by 2030, with Scale-Up adding an additional $4–6 billion in entirely new market value.
According to CRU, data center fiber now accounts for 12.67% of total global fiber demand (up from just 3.65% in 2023), and this share is projected to reach 35% by 2027. AI data centers will consume more fiber than all traditional telecom operators combined within the next 18–24 months.
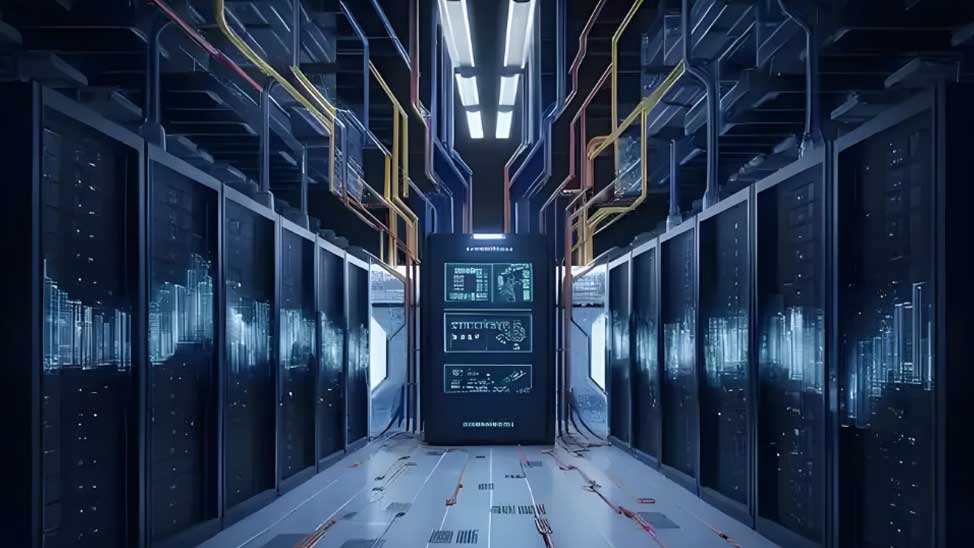
High-speed fiber optic cabling in an advanced computing center — the physical layer that connects thousands of GPUs into a unified AI compute fabric
Chapter 6: Global Market Landscape — China's Four Giants Control Half the World
Chinese manufacturers collectively hold 47.4% of global fiber production capacity in 2025, up from ~42% previously. This consolidation has significant implications for global supply chain resilience and pricing dynamics.
| Company | Global Market Share (2025) | Key Products | Strategic Position |
|---|---|---|---|
| Corning (USA) | 19.5% | LEAF, Vascade, Specialty fibers | LTA with Meta, NVIDIA; dominant in North America Hyperscaler market |
| YOFC (长飞光纤, China) | 14.6% | G.652.D, G.657.A2, Hollow-core fiber | Order backlog > RMB 12B; largest Chinese exporter globally |
| ZTT (中天科技, China) | 11.4% | G.657.A2, G.654.E, Submarine cables | Overseas orders booked through 2027; deposits required to lock capacity |
| HTGD (亨通光电, China) | 11.2% | G.652.D, G.655, Marine fiber | Strong in emerging markets and Belt & Road projects |
| Accelink (烽火通信, China) | 10.2% | G.652.D, OPGW, Specialty cables | Strong telecom operator relationships; government projects |
| Chinese "Big Four" Combined | 47.4% | Near half of global fiber production — a structural shift in market power | |
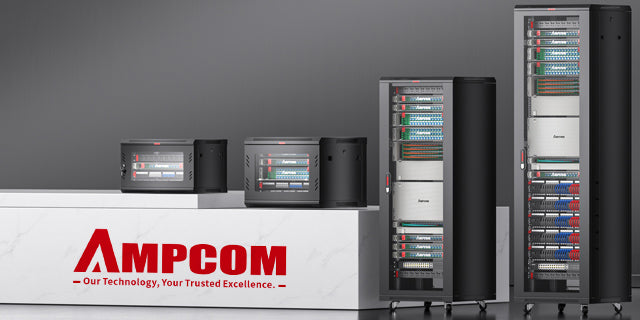
Professional data center infrastructure with structured cabling — the foundation that connects global fiber supply to enterprise and hyperscale deployments
Chapter 7: Hollow-Core Fiber — The Next Disruptor Entering Commercial Deployment
What Makes Hollow-Core Different
Beyond the near-term supply crunch, the structural story of this cycle includes the accelerating commercialization of hollow-core fiber (HCF). Unlike conventional solid-core fiber, HCF guides light through a hollow air-filled center, achieving ~30% lower latency and attenuation as low as 0.1 dB/km in leading products. For AI training interconnects and financial trading networks, sub-millisecond latency has direct monetary value.
Commercial HCF Deployment Progress (2025–2026)
- Microsoft: Announced deployment of ~15,000 km of hollow-core fiber over two years
- AWS: Began HCF deployment in 2025 for latency-sensitive AI workloads
- China's Three Major Telecom Operators (China Mobile, China Telecom, and China Unicom): Combined procurement exceeded 4 million fiber-kilometers (2025), with trials running across Beijing, Shanghai, and Shenzhen
- China Mobile: Deployed the world's first 24-core multi-core single-mode fiber achieving 2.5 Pb/s in the S+C+L bands
- HCF Market Size (2026E): ~RMB 5 billion globally
Multi-Core Fiber: The Next Capacity Frontier
The multi-core fiber technology deployed by China Mobile and Pengcheng Laboratory — achieving 24-core single-mode fiber with 2.5 Pb/s capacity in S+C+L bands — represents a fundamentally new approach to fiber capacity scaling. Unlike traditional single-core fibers where capacity is limited by the nonlinear effects of glass, multi-core fibers add spatial dimensions to increase total capacity without increasing the physical fiber count proportionally.
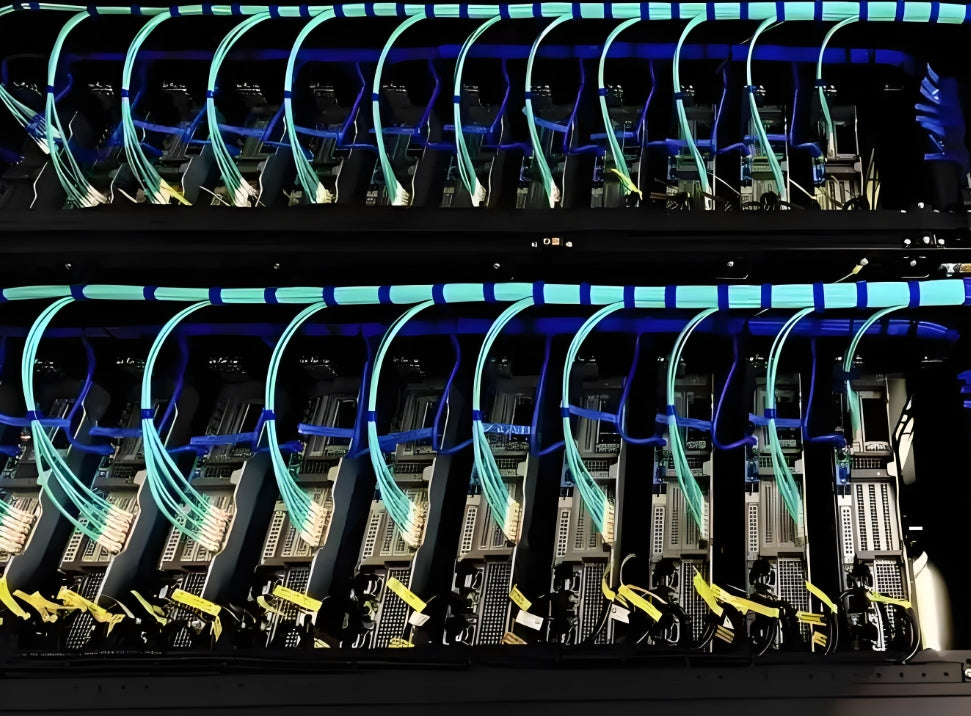
Fiber optic network infrastructure — as hollow-core and multi-core fiber technologies advance, the physical layer of global networks is undergoing its most significant transformation since the advent of single-mode fiber
Chapter 8: Procurement Action Items — What Infrastructure Buyers Must Do Now
⚡ Action Items for Procurement & Planning Teams
1. Lock in supply now: With lead times at 20–52 weeks for standard products and nearly a year for specialty fibers, procurement cycles need to start 12–18 months ahead of project kickoff.
2. Spec the right fiber: G.657.A2 for high-density data center deployments; G.654.E for long-haul DCI; G.652.D as the standard workhorse — don't over-specify if not needed.
3. Plan for price volatility: The pricing environment will remain elevated through 2027–2028; budget accordingly and consider multi-year LTAs if volumes are predictable.
4. Watch the hollow-core opportunity: If latency is mission-critical (AI training interconnects, financial trading, edge AI), engage hollow-core fiber suppliers now for evaluation and pilot programs.
5. Verify Chinese supplier capacity: With 47% global market share, Chinese fiber manufacturers (YOFC, ZTT, HTGD, Accelink) are critical supply chain partners — but demand is global, so early engagement is essential.
5 Core Questions to Ask Your Fiber Supplier Today
1️⃣ What is your current lead time for G.652.D standard single-mode fiber?
Current industry standard: 20–52 weeks. Anything shorter should be verified against confirmed preform availability.
2️⃣ Do you have G.657.A2 stock, and what are the volume constraints?
G.657.A2 is the most constrained specialty fiber type. Confirm exact specifications (A2 vs. A1 bend performance) and minimum order quantities.
3️⃣ Are you willing to enter a multi-year LTA with a price floor?
For volumes above 10,000 fiber-km annually, an LTA with price collar provisions protects against both price spikes and over-commitment by the supplier.
4️⃣ What is your preform sourcing strategy, and do you have backup suppliers?
With preform as the true bottleneck, understanding your supplier's preform sourcing reduces the risk of unexpected delivery delays.
5️⃣ Are you evaluating or deploying hollow-core fiber for any current projects?
If latency matters, the HCF evaluation window is now open — and pilot programs can lock in supplier relationships before commercial pricing normalizes.

Professional cabling installation and maintenance — as fiber supply tightens, proper planning and early procurement become the difference between on-time and delayed deployments
Chapter 9: Key Takeaways & Conclusion
| Dimension | 2024 Baseline | 2027 Forecast | Change |
|---|---|---|---|
| Global Fiber Demand | ~595M fiber-km | 889M fiber-km | +49% in 3 years |
| AI Share of Total Demand | <5% | 35% | 7× increase |
| Data Center Fiber (Global) | ~39M fiber-km | 244M fiber-km | +526% |
| Supply-Demand Gap | ~5% | 15–16.4% | Structural widening |
| Standard Lead Time | 8–12 weeks | 20–52 weeks | 4–6× longer |
| G.657.A2 Specialty Price | $3–4/fiber-km | $30+/fiber-km | ~10× increase |
| Chinese "Big Four" Market Share | ~42% | ~47.4% | Consolidating dominance |
| Market Cycle Character | Telecom-driven, single force | AI + Defense + Telecom, multi-force | New structural paradigm |
Conclusion: A Structural, Not Cyclical, Upswing
The 2027 CRU forecast of 8.8 billion fiber-km demand is not a temporary spike — it reflects a fundamental reweighting of the global economy toward AI infrastructure. The 2015–2018 cycle was driven by FTTH connecting people. This cycle is driven by AI connecting GPUs, data centers, and autonomous systems. The demand profile is broader, more diverse, and — critically — more persistent.
For the fiber optic cable industry, the era of commoditization appears to be over. For buyers and infrastructure planners, the era of proactive supply chain management has just begun. The data centers and enterprise networks that build strong supplier relationships today will be the ones that can deploy on schedule in 2027 and beyond.

AMPCOM Technical Team
Industry experts with 17+ years in structured cabling, data center infrastructure, and fiber optic network design
Need help planning your fiber infrastructure procurement?
AMPCOM provides a full range of high-performance fiber and copper cabling solutions for data centers, enterprise networks, and industrial installations. Our team of certified engineers can help you select the right fiber specifications for your AI-ready infrastructure.
Talk to AMPCOM Engineering →

