
The Year 800G Fiber Goes Mainstream: New Challenges in Data Center Structured Cabling
Published:Executive Summary: The global 800G transceiver market is projected to reach $4.2 billion by 2028, with major cloud providers deploying over 50,000 800G ports per quarter. This transition from 400G brings unprecedented challenges in fiber density, connector technology, optical performance, testing complexity, thermal management, and workforce readiness. This comprehensive guide examines each challenge with real-world data, case studies, and actionable recommendations for data center operators preparing for 800G infrastructure.
Quick Navigation
- 1 Why 800G? The Data Behind the Transition
- 2 Challenge 1: Fiber Density and Cable Management
- 3 Challenge 2: Connector Technology Evolution
- 4 Challenge 3: Optical Performance Requirements
- 5 Challenge 4: Testing and Certification Complexity
- 6 Challenge 5: Thermal and Environmental Considerations
- 7 Challenge 6: Skill Gap and Training Requirements
- 8 Strategic Recommendations for 800G Readiness
- 9 The Future Beyond 800G: Preparing for 1.6T
- 10 Conclusion: The 800G Imperative

High-density cabling environments demand meticulous planning to accommodate 800G fiber infrastructure
Chapter 1: Why 800G? The Data Behind the Transition
The shift to 800G isn't arbitrary—it's driven by measurable operational requirements and economic calculations that make it inevitable for modern data centers.
AI Workload Bandwidth Demand
AI infrastructure and large language model (LLM) training require massive east-west traffic between GPU clusters. Consider these real-world numbers:
Speed Evolution Comparison
The transition from 100G through 400G to 800G represents more than speed increases—it fundamentally changes infrastructure requirements:
| Generation | Year | Typical Application | Fiber Strands (SR) | Power per Port | Cost per Gbps |
|---|---|---|---|---|---|
| 100G | 2016-2020 | Enterprise Core | 2-4 fibers | 3.5W | $12/Gbps |
| 400G | 2020-2025 | Data Center Spine | 8 fibers | 10-12W | $8/Gbps |
| 800G | 2025-2030 | AI/ML Clusters | 8-16 fibers | 15-20W | $5/Gbps |
| 1.6T | 2027+ | Hyperscale Core | 16-32 fibers | 25-30W | $3.5/Gbps (projected) |
💡 Key Insight
While absolute power per port increases, the cost per Gbps and power efficiency per bit both improve significantly at 800G, making it economically compelling for high-density deployments.
Q: Why is 800G adoption accelerating in 2026 specifically?
A: Three factors converge: (1) IEEE 802.3ck standards are now ratified, ensuring interoperability; (2) component costs dropped 60% in 2025, making 800G economically viable; (3) AI training workloads now exceed 400G capacity in major cloud regions.
Q: Can existing 400G infrastructure support 800G upgrades?
A: Partially. While some MPO-12 infrastructure can be adapted, most 800G deployments require MPO-16 or MPO-24 connectors, necessitating panel and cabling upgrades. Loss budgets are also 30-40% tighter, requiring higher-quality components.
Chapter 2: Challenge 1 — Fiber Density and Cable Management
The most immediate challenge with 800G is fiber density. A single 800G-SR8 transceiver uses 8 multimode fibers, but parallel architectures for redundancy and capacity often require 16, 32, or even 64 fiber strands per connection path.
Trunk Cable Capacity Comparison
MPO fiber solutions and trunk cable selection must account for dramatically higher fiber counts:
| Trunk Cable Type | Fiber Count | 100G Links | 400G Links | 800G Links |
|---|---|---|---|---|
| Traditional Low-Density | 72 fibers | 18 links | 9 links | 4-5 links |
| Standard High-Density | 144 fibers | 36 links | 18 links | 9 links |
| Ultra-High-Density | 288 fibers | 72 links | 36 links | 18 links |
| Next-Gen Massive | 864 fibers | 216 links | 108 links | 54 links |
📋 Case Study: Meta's AI Data Center Expansion (2025)
Challenge: Meta's new AI training cluster required 12,000 GPU interconnects, translating to 96,000 fiber strands for a single cluster.
Solution: Deployed 864-fiber trunk cables with pre-terminated MPO-24 cassette modules, reducing installation time by 65% compared to field-termination approaches.
Result: Achieved 99.7% first-pass certification rate, with only 0.3% requiring rework—down from 8% rework rate in previous 400G deployments using MPO-12.
Patch Panel Density Challenges
Standard 1U patch panels cannot serve 800G environments efficiently. Understanding the trade-offs between panel types is critical:
| Panel Type | Port Capacity | Fiber Capacity | Pros | Cons |
|---|---|---|---|---|
| Traditional 1U LC Panel | 24-48 ports | 48-96 fibers | Familiar, easy to troubleshoot | Insufficient for 800G density |
| 1U MPO-12 Cassette | 4-6 cassettes | 48-72 fibers | Modular, quick replacement | Limited to 400G SR4/SR8 |
| 1U MPO-16/24 High-Density | 8-12 cassettes | 128-288 fibers | 800G-ready, space-efficient | Requires precision labeling |
| 0.5U Ultra-High-Density | 16+ cassettes | 384+ fibers | Maximum density per RU | Difficult to access, thermal concerns |

800G deployments require rethinking traditional rack and cable management strategies
Q: How much rack space does 800G require compared to 400G?
A: For equivalent port counts, 800G typically requires 2-3x the fiber termination space. A 48-port 800G deployment using SR8 may need 2-3U of patch panel space versus 1U for 400G SR4. Using high-density MPO-24 cassettes can reduce this to 1.5U.
Q: What's the minimum trunk cable size recommended for new 800G deployments?
A: For greenfield deployments, minimum 288-fiber trunk cables are recommended. This provides headroom for growth and redundancy without requiring pathway expansion within 5 years.
Chapter 3: Challenge 2 — Connector Technology Evolution
800G is accelerating the shift toward MPO-16 and MPO-24 connectors, creating compatibility issues with existing MPO-12 infrastructure.
MPO Connector Type Comparison
Selecting the right connector type impacts both current performance and future upgradeability:
| Connector Type | Fiber Count | Speed Support | Loss Budget | Cost Premium |
|---|---|---|---|---|
| MPO-8 | 8 fibers | 100G SR4, 400G SR4 | 0.35 dB | Baseline |
| MPO-12 | 12 fibers | 40G SR4, 100G SR4, 400G SR4 | 0.35 dB | +5-10% |
| MPO-16 | 16 fibers | 400G SR8, 800G SR8 | 0.40 dB | +15-20% |
| MPO-24 | 24 fibers | 800G SR8/SR16, 1.6T (future) | 0.45 dB | +25-35% |
📋 Case Study: AWS 800G Deployment Challenges (2025)
Scenario: AWS attempted to upgrade an existing 400G MPO-12 infrastructure to support 800G SR8 transceivers.
Problem: MPO-12 to MPO-16 adapter cassettes introduced additional insertion loss of 0.8 dB per connection, exceeding the 800G SR8 total loss budget of 1.5 dB.
Lesson: Retrofitting existing MPO-12 infrastructure for 800G is often more costly than greenfield MPO-16/24 deployment due to cumulative losses and rework requirements.
Outcome: AWS now mandates MPO-24 cassettes for all new deployments, regardless of current speed requirements, to ensure 800G upgradeability.
Polarity Management Complexity
With higher fiber counts comes increased polarity complexity:
| Polarity Method | MPO-12 Application | MPO-16/24 Application | Complexity Level |
|---|---|---|---|
| Method A | Simple TX-RX flip | Requires careful documentation | Low |
| Method B | Standard for most 40G/100G | Standard for 400G/800G SR8 | Medium |
| Method C | Rarely used | Not recommended for 800G | High |
| Universal | Not applicable | Preferred for MPO-16/24 flexibility | Medium |
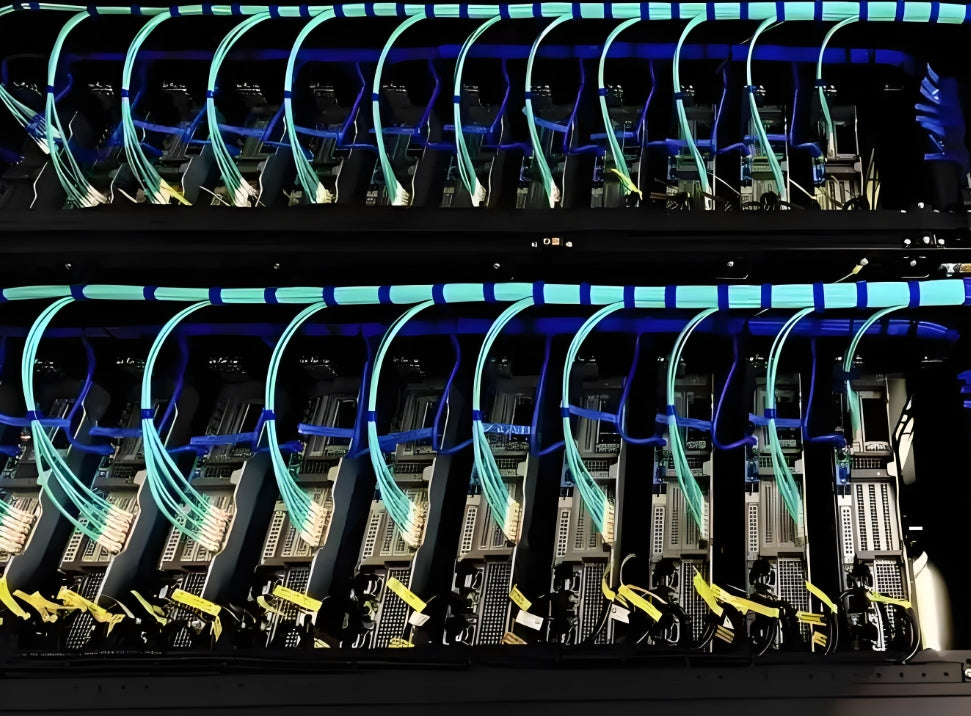
MPO-24 connectors provide future-proofing for 800G SR16 and 1.6T applications with minimal cost premium
Q: Should I standardize on MPO-16 or MPO-24 for new deployments?
A: MPO-24 is recommended. While MPO-16 suffices for 800G SR8, MPO-24 provides future-proofing for 800G SR16 and 1.6T applications with minimal cost premium.
Q: What's the typical failure rate for MPO-16/24 versus MPO-12?
A: Field data shows MPO-16/24 has 15-20% higher initial failure rates during installation, primarily due to contamination. Implementing mandatory microscope inspection reduces this to below MPO-12 failure rates.
Chapter 4: Challenge 3 — Optical Performance Requirements
800G pushes optical performance to new limits, making previously acceptable practices problematic.
Loss Budget Comparison by Speed
The tightening loss budgets at 800G require precision engineering throughout the cabling channel:
| Speed & Standard | Fiber Type | Reach | Channel Loss Budget | Connector Loss Allowed | Margin for Splices |
|---|---|---|---|---|---|
| 100G SR4 | OM4 | 100m | 1.9 dB | 2 × 0.5 dB | 0.9 dB |
| 400G SR8 | OM4 | 100m | 1.5 dB | 2 × 0.35 dB | 0.8 dB |
| 800G SR8 | OM4 | 100m | 1.5 dB | 2 × 0.35 dB | 0.8 dB |
| 800G SR4.2 | OM4 | 100m | 1.0 dB | 2 × 0.25 dB | 0.5 dB |
⚠️ Critical Warning
800G SR4.2 has a loss budget of only 1.0 dB—tighter than any previous multimode standard. Each connector pair must achieve under 0.25 dB insertion loss, and splices must be under 0.1 dB. Standard installation practices from 100G/400G deployments will result in certification failures.
Real-World Loss Accumulation Example
Consider a typical 800G link with the following components:
| Component | Quantity | Typical Loss Each | Total Loss |
|---|---|---|---|
| MPO-24 Cassette (patch panel) | 2 | 0.35 dB | 0.70 dB |
| Trunk Cable (OM4, 50m) | 1 | 0.15 dB | 0.15 dB |
| Splice (fusion) | 2 | 0.08 dB | 0.16 dB |
| Macro-bend (poor installation) | 1 | 0.5 dB | 0.50 dB |
| TOTAL | 1.51 dB | ||
Result: This link would FAIL 800G SR4.2 certification (budget: 1.0 dB) and barely pass 800G SR8 (budget: 1.5 dB) with zero margin for degradation.
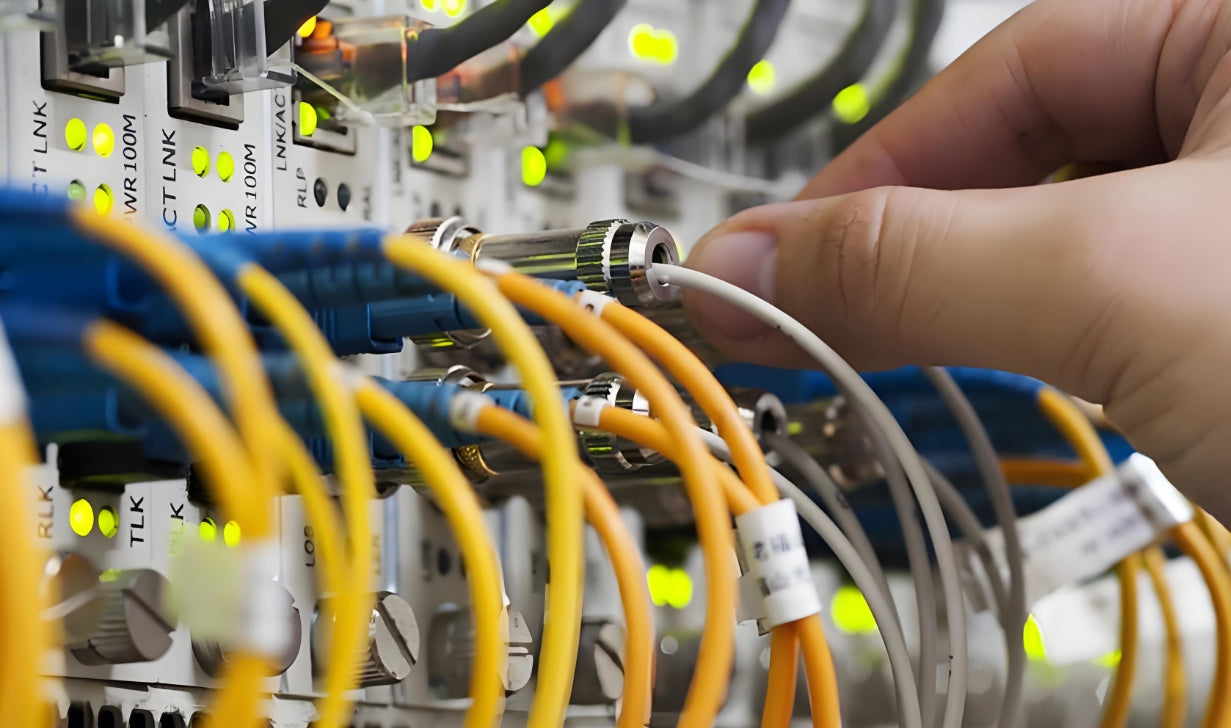
Rigorous optical testing becomes non-negotiable for 800G certification
Q: What's the single most common cause of 800G link failures?
A: Dirty connector end-faces account for 65% of 800G failures. At 800G loss budgets, a single 5μm particle can add 0.5-1.0 dB loss. Mandatory fiber microscope inspection before every connection is now essential.
Q: Should I use APC (Angled) connectors for 800G multimode?
A: Yes, for 800G SR4.2 and all 800G applications over 70m. APC connectors reduce back-reflection from -20 dB (UPC) to -60 dB, preventing signal degradation in sensitive PAM4 receivers. Cost premium is only 10-15%.
Chapter 5: Challenge 4 — Testing and Certification Complexity
Testing 800G infrastructure requires more sophisticated equipment and procedures than previous generations.
Test Equipment Requirements
| Test Type | 100G Requirement | 400G Requirement | 800G Requirement | Cost Increase |
|---|---|---|---|---|
| OLTS (Loss Test Set) | Standard ±0.2 dB | High-accuracy ±0.15 dB | Precision ±0.1 dB with EF compliance | +40% |
| OTDR | 5m event dead zone | 2m event dead zone | 1m event dead zone, MPO-capable | +65% |
| Fiber Microscope | 200x magnification | 400x magnification | 400x + IEC 61300-3-35 auto-analysis | +30% |
| MPO Test Adapter | MPO-12 fan-out | MPO-12/MPO-16 | MPO-16/MPO-24 single-scan | +80% |
| BER Tester | NRZ modulation | PAM4 (optional) | PAM4 mandatory | +120% |
Certification Workflow Comparison
| Step | 100G/400G Process | 800G Process | Time Impact |
|---|---|---|---|
| 1. Visual Inspection | Optional, visual check | Mandatory microscope + IEC grading | +3 min/link |
| 2. Cleaning | As-needed | Always before each test | +1 min/link |
| 3. OLTS Test | Single-direction acceptable | Bi-directional mandatory | +2 min/link |
| 4. OTDR Trace | Spot-check only | Every link, stored in database | +4 min/link |
| 5. Documentation | Paper acceptable | Digital, TIA-606-B format | +2 min/link |
| Total Per-Link Time | ~5 minutes | ~17 minutes | +240% |
📋 Case Study: Google Cloud 800G Certification Project (2025)
Project: 15,000 800G links across 3 data centers
Initial Approach: Applied existing 400G certification workflow
Problem: 12% failure rate on first-pass certification, primarily due to marginal losses within budget but causing intermittent BER errors under load
Resolution: Implemented stricter test criteria with 30% margin below maximum loss budget, mandatory bi-directional testing, and automated IEC-grade inspection
Result: Reduced rework from 12% to 0.8%, saving $2.3M in labor and material costs
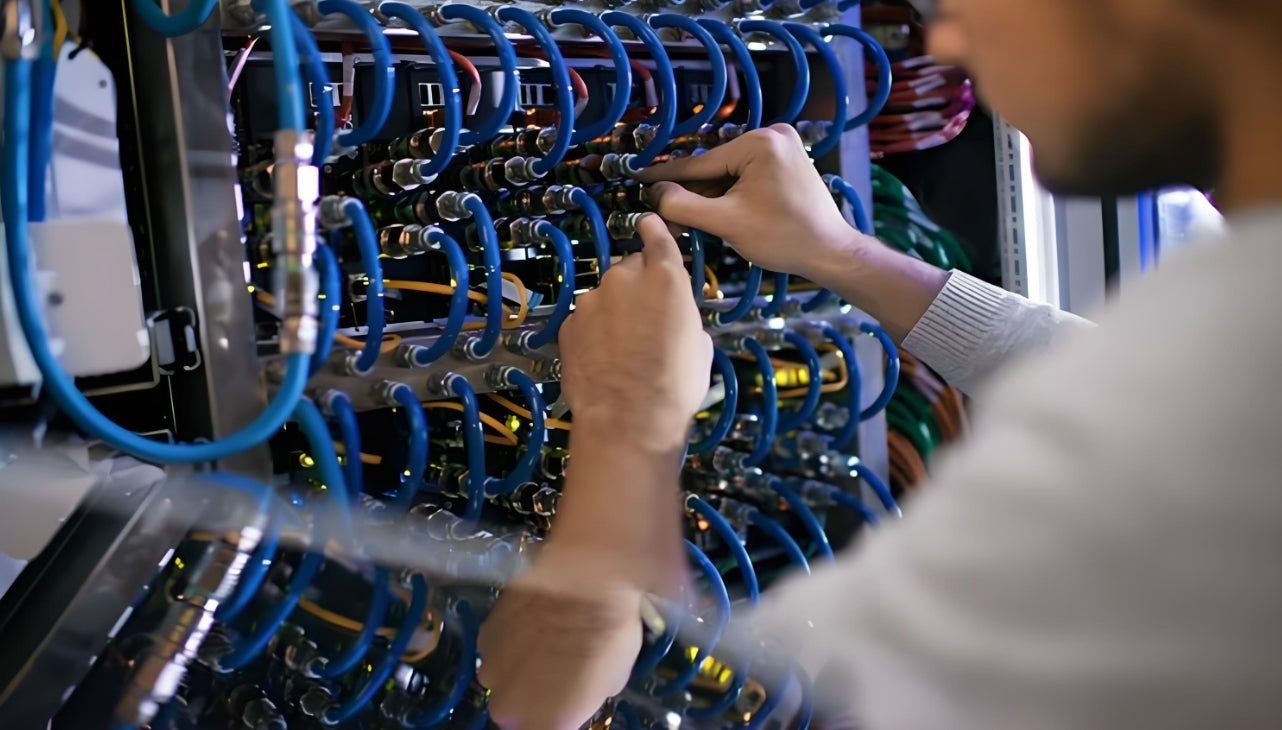
Comprehensive power monitoring at every level supports both tax compliance and efficiency optimization
Q: Can I use my existing 400G test equipment for 800G?
A: Partially. Most OLTS and OTDR units can measure 800G links if accuracy meets ±0.1 dB specs. However, MPO-24 test adapters and PAM4 BER testers require new equipment investment. Budget $15,000-25,000 per test kit upgrade.
Q: What's the minimum test documentation required for 800G?
A: TIA-606-B compliant records including: unique link ID, test date, technician ID, bi-directional loss values per fiber, OTDR trace file, IEC-grade inspection images, and equipment calibration certificates. Digital storage is mandatory.
Chapter 6: Challenge 5 — Thermal and Environmental Considerations
800G transceivers generate more heat than their predecessors, and concentrated fiber density creates thermal challenges.
Power and Heat Comparison
| Transceiver Type | Power Consumption | Heat Output | Typical Port Density | Heat per 1U Switch |
|---|---|---|---|---|
| 100G SR4 | 3.5W | 12 BTU/hr | 32-48 ports | 384-576 BTU/hr |
| 400G SR8 | 12W | 41 BTU/hr | 32-48 ports | 1,312-1,968 BTU/hr |
| 800G SR8 | 18W | 61 BTU/hr | 32-64 ports | 1,952-3,904 BTU/hr |
| 800G DR8 | 22W | 75 BTU/hr | 32-64 ports | 2,400-4,800 BTU/hr |
🔥 Thermal Impact
A fully populated 64-port 800G SR8 switch generates up to 3,904 BTU/hr—equivalent to a small space heater. This requires data center cooling capacity increases of 15-25% compared to 400G deployments.
Airflow and Cable Obstruction Analysis
| Cable Tray Fill Level | Airflow Reduction | Temperature Rise | Impact on 800G Performance |
|---|---|---|---|
| 40% fill (recommended) | Baseline | 0°C | Optimal |
| 60% fill | 15% reduction | +2°C | Marginal, acceptable |
| 80% fill | 35% reduction | +5°C | Risk of thermal throttling |
| 100% fill (overloaded) | 55% reduction | +9°C | High risk of BER errors, premature failure |
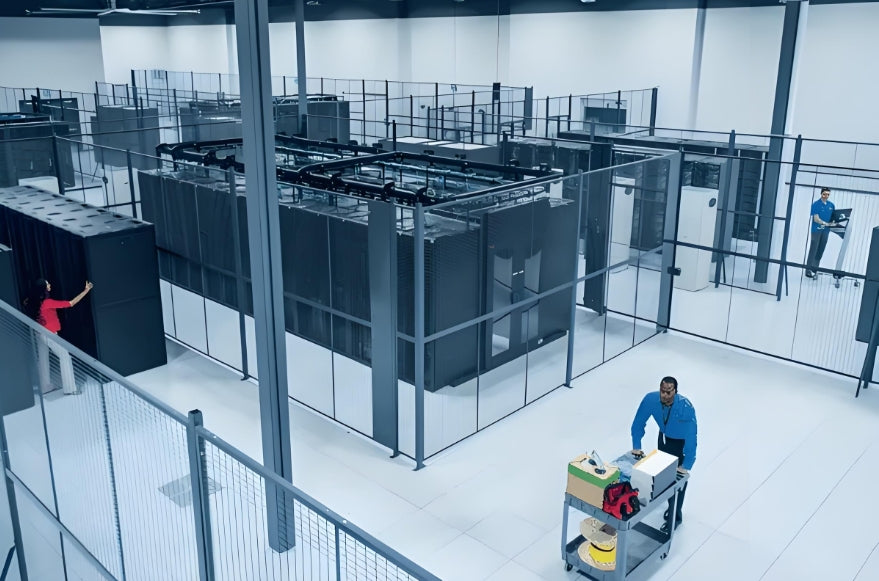
Thermal imaging reveals how cable density can impact data center cooling efficiency
Q: How much additional cooling capacity do I need for 800G?
A: Plan for 20-30% more cooling capacity compared to equivalent 400G deployments. This accounts for both higher transceiver power and reduced airflow from denser cabling.
Q: What cable tray fill percentage is safe for 800G?
A: Maximum 50% fill for overhead trays, 40% for underfloor pathways. This maintains adequate airflow and allows for future cable additions without thermal penalties.
Chapter 7: Challenge 6 — Skill Gap and Training Requirements
800G infrastructure requires skills that many current technicians lack. This gap represents one of the biggest risks to successful deployment.
Skill Gap Assessment
| Skill Area | 100G/400G Requirement | 800G Requirement | Gap Severity | Training Time |
|---|---|---|---|---|
| MPO Inspection & Cleaning | Basic visual inspection | Microscope + IEC auto-analysis | High | 8-16 hours |
| High-Fiber-Count Splicing | Ribbon splicing (12-fiber) | Mass fusion (24-32 fiber) | High | 16-40 hours |
| OTDR Interpretation | Basic event identification | Complex multi-event analysis | Medium | 8-16 hours |
| Loss Budget Calculation | Simple addition | Statistical analysis, margin engineering | Medium | 4-8 hours |
| PAM4 Signal Understanding | Not required | Basic transmitter/receiver parameters | Medium | 4-8 hours |
| Documentation Systems | Paper/spreadsheet acceptable | Digital asset management, TIA-606-B | Low | 2-4 hours |
Certification and Training Programs
| Certification | Provider | 800G Coverage | Duration | Cost |
|---|---|---|---|---|
| CFOS/D (Data Center Specialist) | FOA | Full 800G module available | 24 hours | $1,200-1,800 |
| RCDD + Data Center Specialty | BICSI | 800G in 2025 curriculum update | 40+ hours | $3,500-5,000 |
| DCICN (Data Center Infrastructure) | Cisco | Includes 800G transceiver config | 16 hours | $800-1,200 |
| Vendor-Specific | Manufacturer | MPO-16/24 specific training | 4-8 hours | $200-600 |
📋 Case Study: Microsoft Azure Training Initiative (2025)
Challenge: Needed to upskill 350 field technicians for 800G deployments across 12 regions
Approach: Developed tiered training program:
- Tier 1 (Basic): MPO inspection/cleaning certification (8 hours)
- Tier 2 (Intermediate): 800G testing and certification (16 hours)
- Tier 3 (Advanced): Troubleshooting and OTDR analysis (24 hours)
Investment: $420,000 total training cost
ROI: Reduced first-time failure rate from 18% to 3%, saving estimated $1.8M in rework costs in first year alone
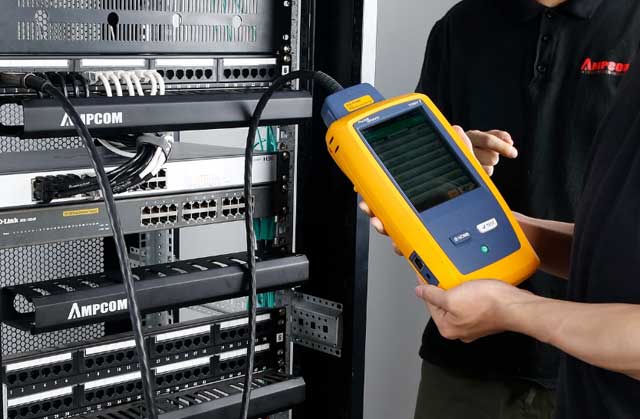
Successful 800G deployments combine proper infrastructure planning with skilled execution
Q: What's the minimum training investment for a team of 10 technicians?
A: Budget $15,000-25,000 for basic 800G certification (Tier 1-2 training), plus $10,000-15,000 for equipment training. Total first-year investment: $25,000-40,000. ROI typically exceeds 300% through reduced rework.
Q: Can technicians with 400G experience adapt to 800G?
A: Yes, but expect a learning curve of 2-4 weeks for experienced technicians. The biggest adaptation is the stricter tolerance for contamination and the need for bi-directional testing discipline.
Chapter 8: Strategic Recommendations for 800G Readiness
Successfully navigating the 800G transition requires proactive planning across multiple dimensions.
Implementation Checklist
| Category | Action Item | Timeline | Priority | Investment |
|---|---|---|---|---|
| Infrastructure Planning | Pathway capacity assessment (2-3x current fiber) | 3-6 months before deployment | Critical | $5,000-15,000 |
| High-density MPO-24 panel standardization | Immediate | Critical | +15-25% vs MPO-12 | |
| Labeling system upgrade (QR/barcode) | Before deployment | High | $2,000-5,000 | |
| Technical Standards | MPO-16/24 default for new multimode | Immediate policy | Critical | N/A (policy) |
| APC connectors for multimode 800G | Immediate policy | High | +10-15% connector cost | |
| OM4/OM5 specification for all new fiber | Immediate policy | Critical | +5-10% cable cost | |
| Quality Assurance | Bi-directional OLTS + OTDR testing mandate | Before deployment | Critical | +40% test time |
| 30% loss margin design standard | Immediate policy | High | Higher-spec components | |
| Digital test result storage | Before deployment | Critical | $3,000-8,000 software | |
| Workforce Development | 800G certification for all fiber technicians | 3-6 months before deployment | Critical | $1,200-1,800/person |
| MPO-specific test equipment deployment | Before deployment | Critical | $15,000-25,000/kit |
ROI Analysis: Investing in 800G-Ready Infrastructure
| Investment Area | Cost Premium vs 400G | 5-Year Savings | Primary Benefit |
|---|---|---|---|
| Higher-capacity trunk cables (288+ fiber) | +20-30% | 40-60% avoid future pathway expansion | Reduced future construction |
| MPO-24 panels vs MPO-12 | +25-35% | 50-70% avoid retrofit costs | 1.6T upgradeability |
| APC multimode connectors | +10-15% | 30-50% reduce link failures | Signal integrity |
| Technician training | $1,500-2,000/person | 200-400% reduced rework costs | First-pass success |
| Upgraded test equipment | +40-80% | 150-250% avoid certification failures | Accurate documentation |

Strategic investment in 800G-ready infrastructure delivers measurable ROI through reduced rework and future-proofing
Q: What's the minimum lead time for 800G readiness?
A: For a mid-sized data center (5,000+ links), plan 6-12 months. This includes: pathway assessment (1-2 months), equipment procurement (2-3 months), technician training (1-2 months), and pilot deployment (1-2 months).
Q: Should I deploy 800G-ready infrastructure even if I'm only deploying 100G/400G today?
A: Absolutely. The cost premium for 800G-ready infrastructure is 15-30%, but retrofit costs when you do upgrade to 800G can exceed 200-300% of original installation costs due to rework, testing, and potential pathway expansion.
Chapter 9: The Future Beyond 800G — Preparing for 1.6T
While the industry focuses on 800G, 1.6T technology is emerging on the horizon. Understanding these trends helps future-proof investments.
Technology Roadmap Comparison
| Technology | Timeline | Cabling Impact | Key Consideration |
|---|---|---|---|
| 1.6T SR8 | 2027-2028 | MPO-16 required, MPO-24 optimal | Similar loss budgets to 800G SR8 |
| 1.6T SR16 | 2027-2028 | MPO-24 mandatory | 2x fiber count vs 800G SR8 |
| Co-Packaged Optics (CPO) | 2026-2028 | Short-reach internal connections | Reduces external cabling complexity |
| Linear Pluggable Optics (LPO) | 2025-2027 | Requires premium cabling (lower loss) | 20-30% power savings vs DSP |
| Multi-Core Fiber (MCF) | 2028+ | Revolutionary: multiple cores per strand | Early stage, standards pending |
🔮 Future Outlook
Data centers deploying MPO-24 infrastructure today will be 1.6T-ready with minimal upgrades. Those deploying MPO-12 will face complete panel and cabling replacement within 3-5 years. The strategic choice is clear.
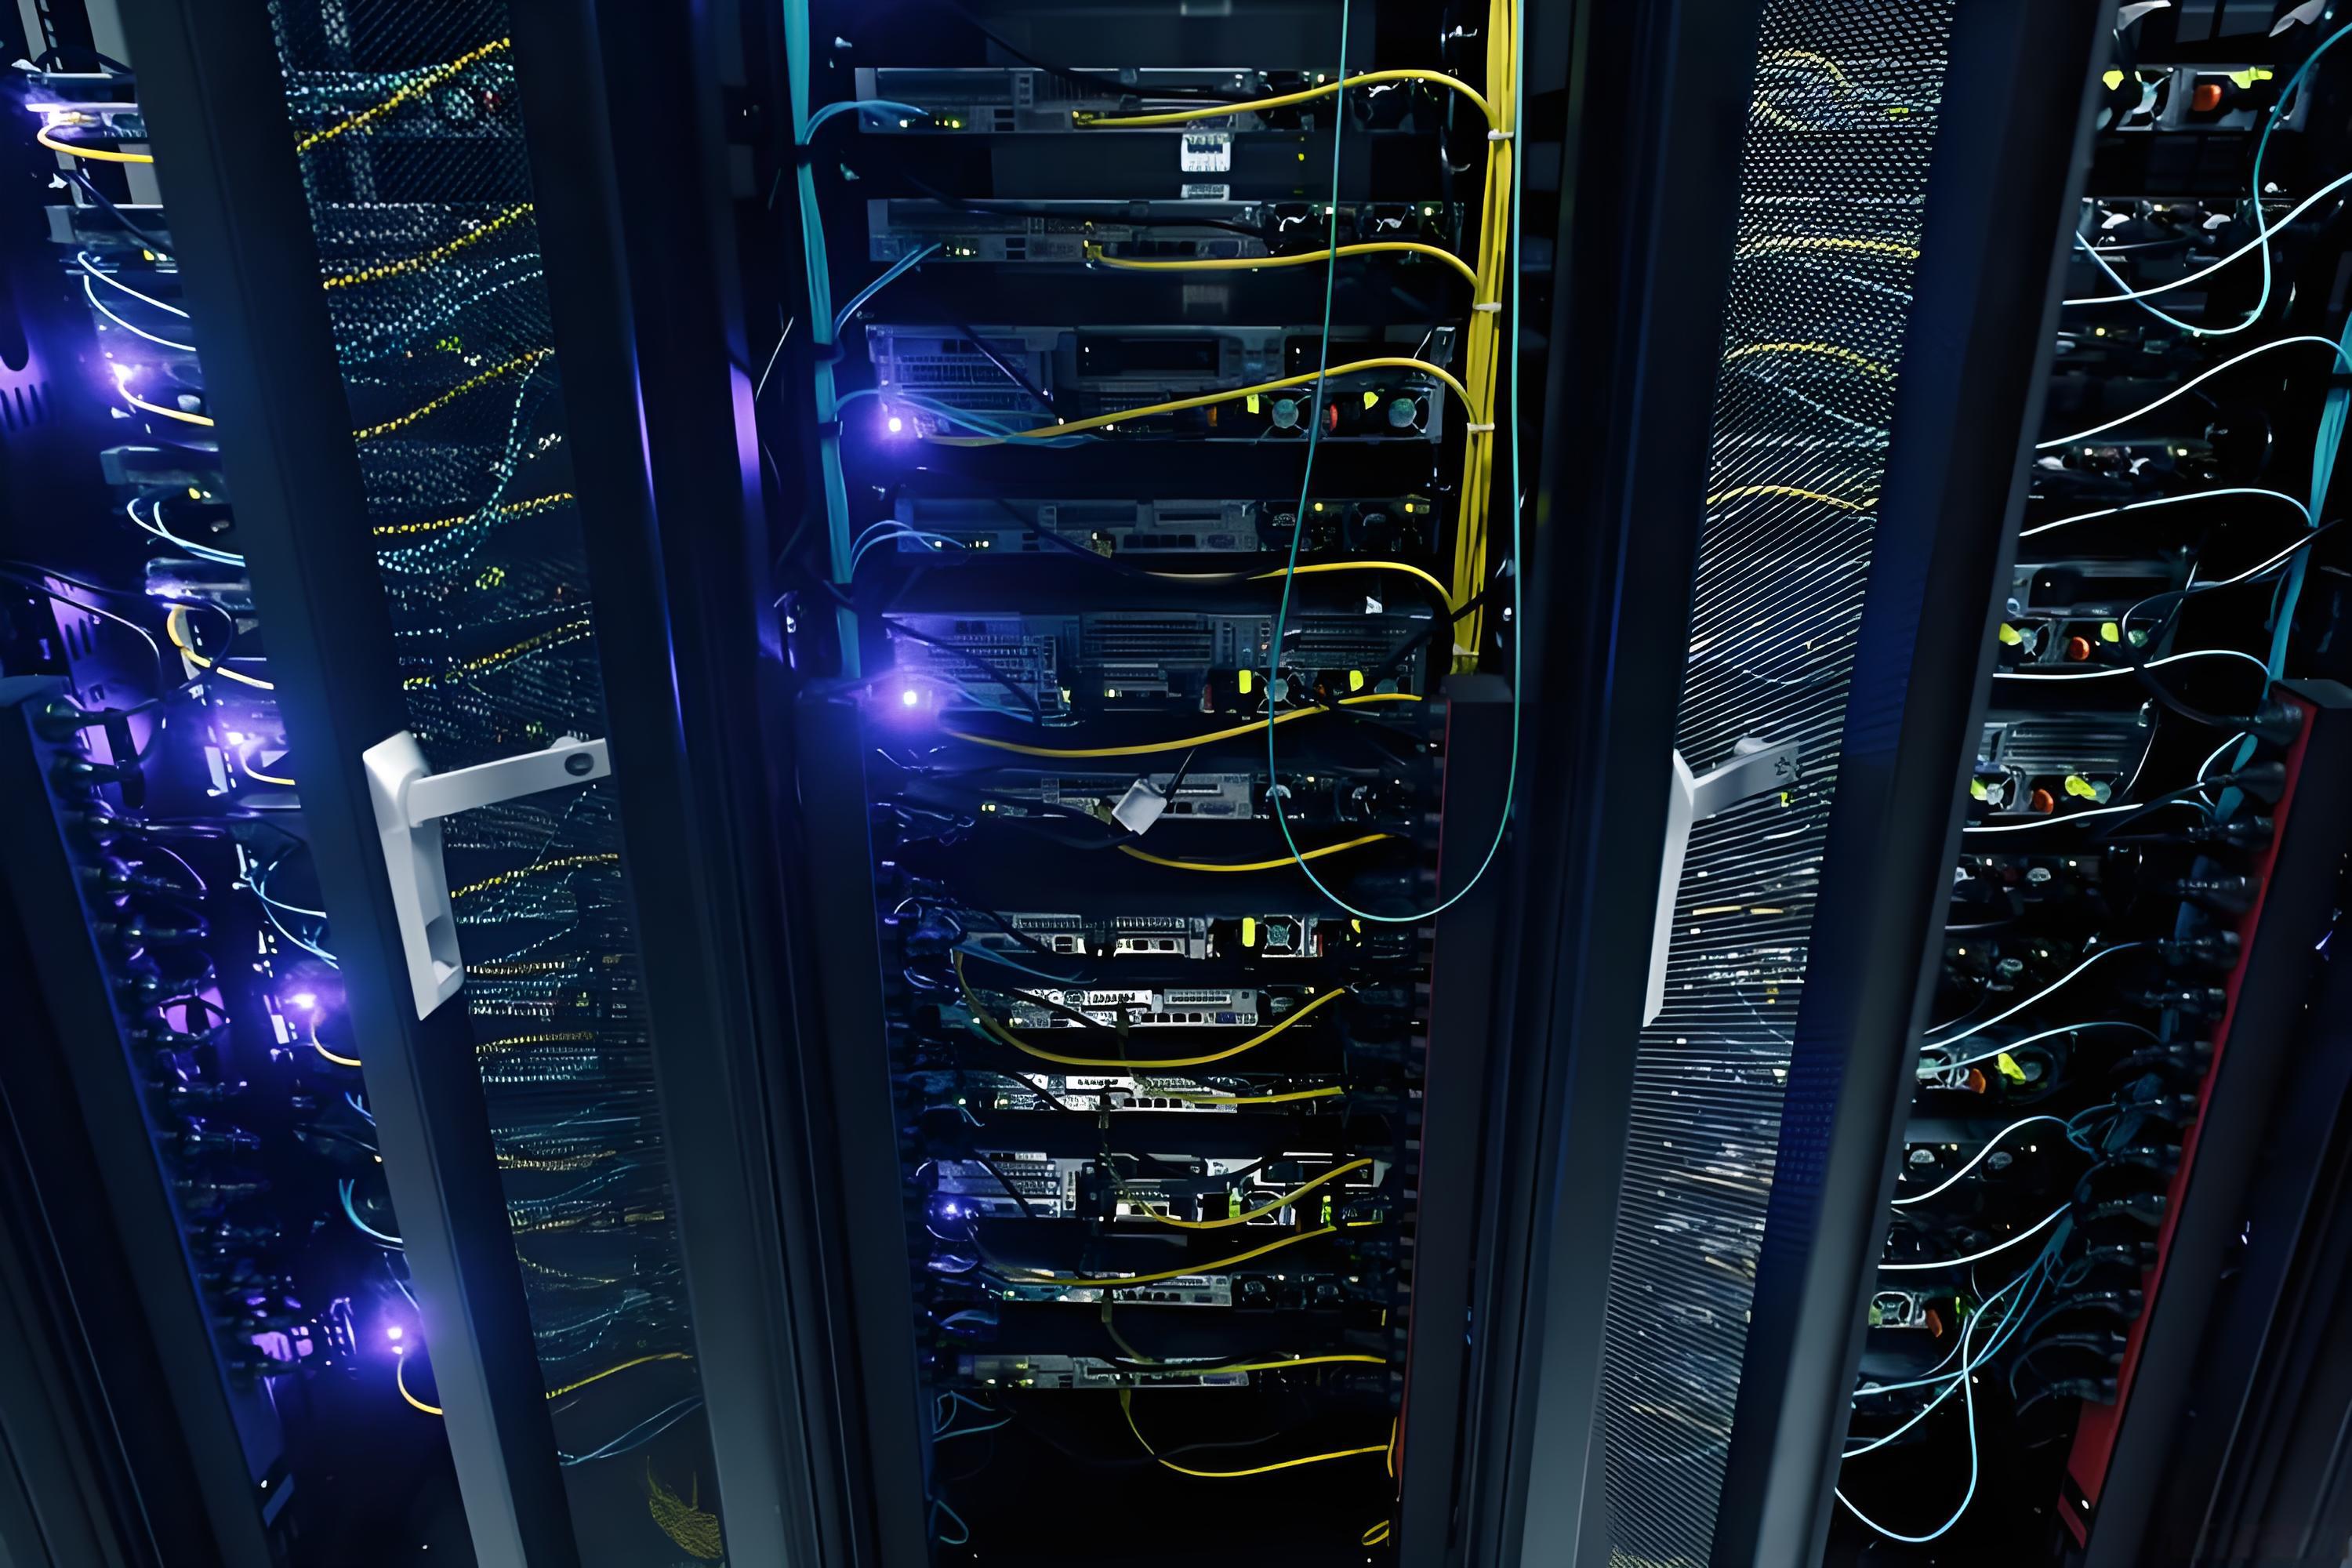
Understanding the evolution from 800G to 1.6T helps infrastructure planners make future-proof decisions
Q: Will my 800G infrastructure support 1.6T?
A: If you deployed MPO-24 panels and OM4/OM5 cable with APC connectors, yes—1.6T SR8 will be a transceiver upgrade only. If you deployed MPO-12 or MPO-16, you'll need panel upgrades for 1.6T SR16 applications.
Q: Should I wait for 1.6T instead of deploying 800G now?
A: No. 800G is production-ready and addresses current AI workload requirements. Waiting 18-24 months for 1.6T means missing critical capacity windows. Deploy 800G-ready infrastructure (MPO-24) now for seamless 1.6T migration later.
Chapter 10: Conclusion — The 800G Imperative
2026 is the year 800G fiber goes mainstream, but this milestone brings profound implications for structured cabling infrastructure. The challenges—fiber density, connector evolution, optical performance, testing complexity, thermal management, and workforce readiness—are interconnected and demand holistic solutions.
Key Takeaways
| Challenge | Critical Action | Business Impact |
|---|---|---|
| Fiber Density | Deploy 288+ fiber trunk cables, MPO-24 panels | Avoid 200%+ retrofit costs |
| Connector Evolution | Standardize on MPO-24, APC connectors | 1.6T upgradeability, reduced failures |
| Optical Performance | Design for 30% loss margin, bi-directional testing | 99%+ first-pass certification |
| Testing Complexity | Invest in precision equipment, mandatory inspection | Avoid 12%+ failure rates |
| Thermal Management | Limit cable tray fill to 50%, upgrade cooling | Prevent thermal throttling |
| Skills Gap | Certify all technicians on 800G procedures | 300%+ ROI through reduced rework |
Success in the 800G era requires viewing cabling not as a commodity but as a strategic asset. Investment in quality infrastructure, rigorous processes, and skilled personnel will differentiate data centers that thrive from those that struggle with performance issues and operational inefficiencies.

AMPCOM Technical Team
Industry experts with 17+ years in structured cabling, data center infrastructure, and fiber optic network design
Need help preparing your data center for 800G infrastructure?
AMPCOM provides comprehensive structured cabling solutions—including MPO-24 cassettes, high-density patch panels, fiber trunk cables, and testing equipment designed for 800G and beyond.
Talk to Our Infrastructure Experts

